

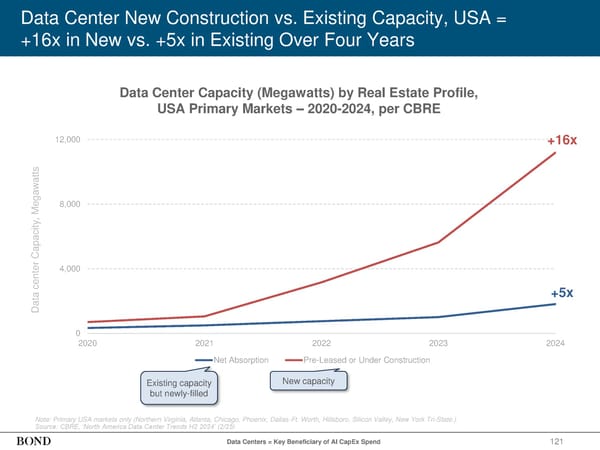
121 Data Center New Construction vs. Existing Capacity, USA = +16x in New vs. +5x in Existing Over Four Years Note: Primary USA markets only (Northern Virginia, Atlanta, Chicago, Phoenix, Dallas-Ft. Worth, Hillsboro, Silicon Valley, New York Tri-State.) Source: CBRE, ‘North America Data Center Trends H2 2024’ (2/25) Data center Capacity, Megawatts 0 4,000 8,000 12,000 2020 2021 2022 2023 2024 Net Absorption Pre-Leased or Under Construction Existing capacity but newly-filled New capacity +16x +5x Data Centers = Key Beneficiary of AI CapEx Spend Data Center Capacity (Megawatts) by Real Estate Profile, USA Primary Markets – 2020-2024, per CBRE
 2025 | Trends in Artificial Intelligence Page 121 Page 123