

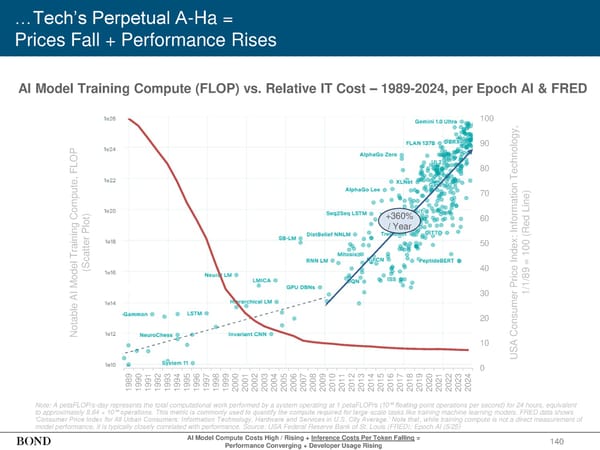
1989 1990 1991 1992 1993 1994 1995 1996 1997 1998 1999 2000 2001 2002 2003 2004 2005 2006 2007 2008 2009 2010 2011 2012 2013 2014 2015 2016 2017 2018 2019 2020 2021 2022 2023 2024 0 10 20 30 40 50 60 70 80 90 100 140 …Tech’s Perpetual A-Ha = Prices Fall + Performance Rises Note: A petaFLOP/s-day represents the total computational work performed by a system operating at 1 petaFLOP/s (10¹⁵ floating-point operations per second) for 24 hours, equivalent to approximately 8.64 × 10¹⁹ operations. This metric is commonly used to quantify the compute required for large-scale tasks like training machine learning models. FRED data shows ‘Consumer Price Index for All Urban Consumers: Information Technology, Hardware and Services in U.S. City Average.’ Note that, while training compute is not a direct measurement of model performance, it is typically closely correlated with performance. Source: USA Federal Reserve Bank of St. Louis (FRED); Epoch AI (5/25) Notable AI Model Training Compute, FLOP (Scatter Plot) USA Consumer Price Index: Information Technology, 1/1/89 = 100 (Red Line) +360% / Year AI Model Compute Costs High / Rising + Inference Costs Per Token Falling = Performance Converging + Developer Usage Rising AI Model Training Compute (FLOP) vs. Relative IT Cost – 1989-2024, per Epoch AI & FRED
 2025 | Trends in Artificial Intelligence Page 140 Page 142